Introduction:
In our fast-paced and demanding world, it can be challenging to find the time and motivation to do the things we truly desire. We often set goals, only to find ourselves falling short of achieving them. However, through introspection and a strategic approach, we can unlock our potential and create a life filled with joy, purpose, and personal fulfillment. In this blog post, we will explore the transformative journey of self-discovery, highlighting the importance of productivity, positivity, and happiness.
1. Setting Clear Goals:
To embark on a fulfilling journey, it is essential to identify and set clear goals. However, merely establishing these objectives is not enough; we must also outline a well-defined plan to accomplish them. Reflecting on our desires and aspirations, we can prioritize the things we truly enjoy, such as gardening, music, vacationing, or exploring new experiences. By dedicating time and energy to these passions, we create a roadmap for personal growth and satisfaction.
2. Embracing Time and Overcoming Limitations:
One common obstacle we face is the perception of limited time. As our leave approaches its end, the fear of not having enough time to pursue our interests can be overwhelming. However, rather than succumbing to this anxiety, we can adopt a proactive mindset. Time is a precious resource, and by organizing our schedules efficiently, we can make the most of it. Through effective time management techniques, we can carve out moments for what truly brings us joy, ensuring a well-balanced and fulfilling life.
3. Cultivating Productivity and Positive Thinking:
To achieve personal growth, productivity and positive thinking play integral roles. By developing habits that promote productivity, such as creating to-do lists, prioritizing tasks, and eliminating distractions, we can optimize our efficiency. Accomplishing small milestones along the way not only boosts our motivation but also instills a sense of achievement and progress. Simultaneously, cultivating a positive mindset allows us to approach challenges with resilience and optimism, enabling us to overcome obstacles and embrace personal growth.
4. Embracing Random Thoughts and Spontaneity:
In the pursuit of self-improvement, it is important to embrace random thoughts and moments of spontaneity. These unexpected sparks of inspiration often lead us to new possibilities and experiences. By allowing ourselves to explore uncharted territories, we can discover hidden passions and unlock dormant talents. Whether it’s picking up a new instrument or trying out a new hobby, these acts of spontaneity can enrich our lives and bring us closer to our authentic selves.
Conclusion:
As we reflect on our desire to seize control of our lives and pursue the things we truly enjoy, it becomes clear that personal growth requires intentional actions and mindset shifts. By setting clear goals, embracing time, cultivating productivity, and nurturing positivity, we can create a life filled with purpose and satisfaction. Through embracing random thoughts and spontaneity, we open ourselves up to new experiences and uncover hidden passions. Remember, the journey towards self-discovery and fulfillment is ongoing, and by adopting these principles, we can unlock our potential and lead a life that is truly extraordinary.
Browse Category by Uncategorized
Career Advices
Focus.
Be patient.
Stay Humble.
Listen & Learn.
Influence people around you.
Make life worthy living.
Stay on a path.
Focus on your strengths.
Listen to your users.
Optimize for simplicity.
Prioritize ruthlessly.
Underpromise, overdeliver.
Be calm and confident (Always Smile).
Be aware of your blindspots.
Don’t worry about things you cannot change.
Make everything measurable.
Taking care of yourself first.
Focus on Measurable Impact.
Views humility collectively.
Always ask: What can I do for you today?
What gets measured, gets done.
Work with people who you can learn from.
Good leaders are willing to be hated.
Always put the other person 1st and say foo and I.
Perfect is the enemy of good.
Collect feedback early.
Manage expectations often and early.
Don’t Criticize, Condemn or Complain.
Always face yourself honestly and continue to polish.
Let your manager speak, explain their expectations.
Say what people need to know. Do not say more than you need to.
Strive to align “skills, interest and opportunity”, take the long view.
If you think a problem is too big for you, go do it anyway.
Be a team player and do what your lead asks you to do.
When in disagreement, first thank someone for what they are doing and then question them.
Do not be attached to code because of how much effort you put into it. Bad code needs to be discarded.
One finger pointing at the other person, three fingers pointing back at us.
I am doing a great job, I am calm and at peace, I am good enough, I am perfect at this moment.
When angry, count to 10 before you speak. If very angry, a hundred.
A can-do optimistic attitude needs to be tempered with a critical look at project goals and timelines.
For junior engineers, don’t limit yourself to a predefined model, say “I will see what can be done” when asked to help.
Be clear and concise about what you want your audience to know.
Play to your strengths, and work on things that you care about. Focus on doing the right thing, and the rest will follow.
We can only see a short distance ahead, but we can see plenty there that needs to be done.
Take care of all challenging/annoying tasks at the beginning of the day.
In reality, there is no such thing as a perfect solution. acknowledge the risks in what we do not know, and make the best decision from there.
Reference:
Manager and Employee Feedback Examples: How To Give Feedback at Work
https://www.leapsome.com/blog/manager-and-employee-feedback-examples-how-to-give-feedback-at-work
Learn about Google’s manager research
https://rework.withgoogle.com/guides/managers-identify-what-makes-a-great-manager/steps/learn-about-googles-manager-research/
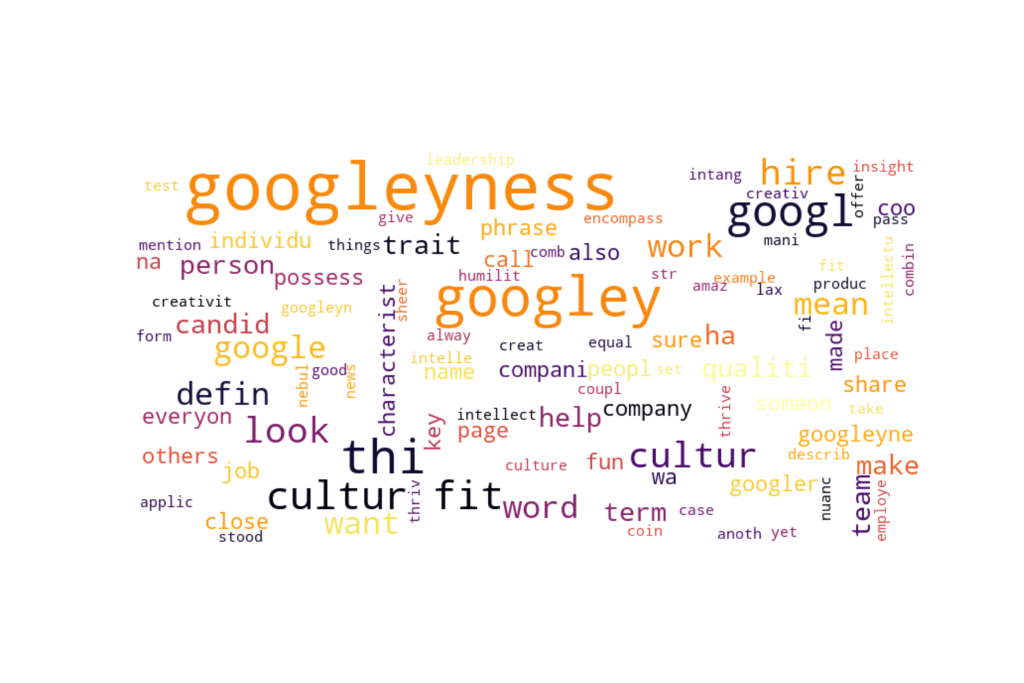
What is Googleyness?
So what is Googleyness? A term that was created to describe Googlers. Then what a typical googler looks like? So I searched it on Google and I found the picture below.

In order to get a better understanding of Googleyness, I recently contacted a couple of my friends who worked at Google. According to them, there is no single definition of Googleyness. For example, my Google engineer friend told me, what distinguishes Google from other tech giants is that, at work, everyone writes code very fast, and they are always willing to help each other. Whereas my Google UX designer friend told me that Googleyness is about understanding users, and being innovative to create products for billions of users.
Their answers got me more excited about Googleyness, so I did a quick analysis of Googleyness using Natural Language Processing. The top five distinctive words associated with Googleyness that I found after scraping first 50 snippets of Google’s search result on Googleyness include the Intellectual, Candid, Humility, Creative and Fun. Below I give my understanding of those top five words:
- Intellectual: Everyone must have the role-related knowledge, or ability to learn role-related knowledge quickly. More importantly, it is about the ability to figure things out by finding simple processes that help work through problems from multiple dimensions and perspectives.
- Candid: Miscommunication is usually one of the root causes of an inefficient team. You must be honest about your ideas, reasonings, and methods so that people can not only understand your projects but also know what actions and influences they can have on your projects. In addition, creative contribution needs candid discussions and inputs.
- Humility: You should realize that the more you learn from work (or life), the more you know you don’t know. So don’t let the title, years of experience, or major expertise block your eyes, you should be open to admit what you know and what you don’t know. And embrace comments, doubts, criticism.
- Creative: Sometimes people do not know what their need for a product until it comes out, for example, VR. As technology becomes more and more advanced, and the Google can better understand users, Googlers should create something that can not only help people live, but also enjoy their life.
- Fun: Working at Google is almost equal to working for billions of people in the world. It is a long road to achieve their ultimate goal. So it is important to have fun along the way!
Please let me know what you think about Googleyness.
Data: Google Spreadsheet
Code: GitHub
Data Visualization
Las Vegas


RESUME
Data for question: Should I apply a mixed effects model?
Data are available here.
Algorithms for Climate Data Sonification
Introduction
Data visualization is the most commonly used approach to analyze and present data. However, patterns, anomalies, or relationships between variables in large and complex datasets may not show up clearly in even the most sophisticated graph. For example, climate time series such as daily temperature data contain information on long-term trends, seasonal variation, localized weather events, and possible measurement or recording errors. It is difficult to design graphs that adequately represent all of these features. My goal of this project is to use sonification to highlight these different features in the dataset to enhance simultaneous graphical explorations.
With the help of my advisor Dr. Mark Greenwood and Dr. Stephen Durbin, I produced a sonification of Bozeman climate data using R shiny. The feedbacks from Dr. Stacey Hancock and my colleagues in Statistical Consulting and Research Services center helped me modify the sonification. In this blog, I will briefly describe the process and the tools that I used for this project.
Data preparation and trend modeling
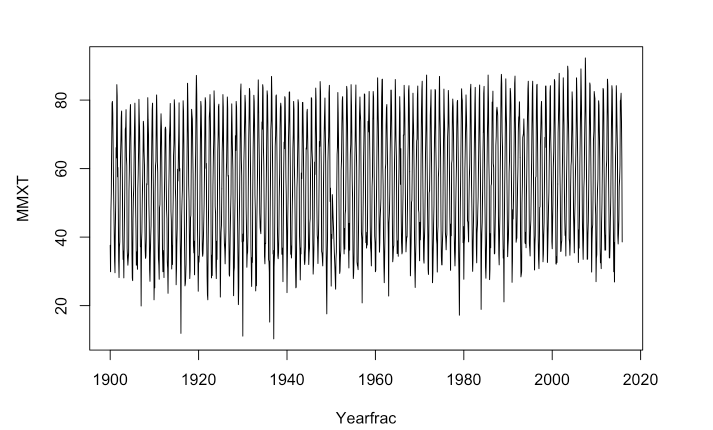
The dataset that I used for this project is Bozeman maximum monthly temperature from January 1900 to November 2015, which consists of four variables (station, station name, date and maximum monthly temperature). As we can see from Figure 1, there are a few missing months.
I used ts (time series) function in R to complete the year fraction of each month in the dataset, other data manipulations can be found in my code. Then I used a generalized additive model to fit a model for the trends of the temperature. Generalized additive model is a method that describes the relationship between a univariate response variable, for example, maximum monthly temperature and some predictor variables such as yearly trends and monthly trends of temperature using smooth functions. The model is stated as below:
g(E(MMXT)) = ß0 + f1(YearlyTrend) + f2(MonthlyTrend) + Residuals.
I used the mgcv package in R to build this model, and it explains 93.6% of the deviances of the data. Here is the model summary:
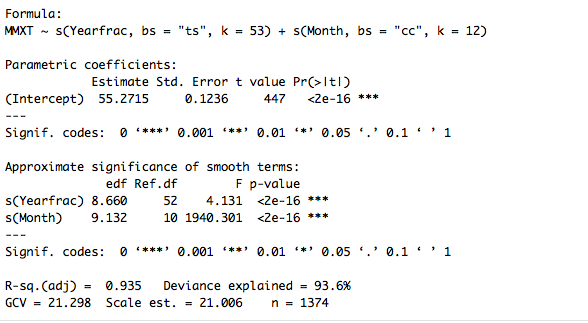
The plot of yearly trends and monthly trends below (Figure 3) suggests that overall, the temperature is estimated to increase by about 4 Fahrenheit degrees over last 115 years, and there continues an increasing trend for the temperature in Bozeman. The monthly trends show that there is a seasonal pattern in the temperature in the data.

Along with long-term trend and seasonal components in the model, I also included the residuals from the model. After building this model, I created a data frame using the values of the model and make it ready for data sonification.
Sonify data
My first approach is to find some R sonification packages and try to build my own sonification package in R. During this process, I found audiolyzeR, sonify, and audio packages in R. These packages can sonify the data, and some sound parameters can be changed in the functions, however, none of them can synthesize different sounds.
After consulting with Dr. Stephen Durbin, I decided to use web audio API to sonify the data. In order to visualize the data while playing the sound, I created R shiny app to show the yearly trends, monthly trends and residuals while the data are sonified. In order to sonify these sounds, I first linearly transformed the yearly trends, monthly trends and residuals into frequencies. I made three different ranges of the frequencies of these three different components of temperature in order to make the sounds of each component distinct from each other, and they are all in one octave.
The monthly trend has the lowest frequency (220 to 440 Hz) because the seasonal trends are pretty constant and systematic, whereas the residuals have the highest frequency (1046.50 to 2093.00 Hz) because of more rapid and frequent changes. The yearly trends have the middle range from 493.88 to 987.77 Hz. Then I used three different instruments to play these three components: grand piano for monthly trend, alto flute for yearly trend and harp for residuals. The audio file of the data sonification can be found here:
The R shiny app is still in the developing process because I want to add more features. However, the data, R code, R shiny app code can be found on my GitHub page.